Thursday, August 18, 2016

Why Are Whole Foods Better than Processed Foods? - the Nano-Food Hypothesis

A protein molecule, such as an antibody, is about 1000 times smaller than a cell. [Image: www.particlescience.com]


Is Whole Food Better for Your Health?

"Never before has there been such a mountain of empirical research supporting a whole foods, plant-based diet." [Colin Campbell, PhD, p. 348-9]

"For more than thirty years, I've directed a series of scientific research studies showing that the progression of even severe coronary heart disease can often be reversed by making comprehensive lifestyle changes. These include a very-low-fat diet including predominantly fruits, vegetables, whole grains, legumes, and soy products in their natural, unrefined forms;" [Dean Ornish, MD, p. 7]

"Starches (rice, corn, potatoes, beans, pasta), green and yellow vegetables, and fruits provide us with large quantities of clean-burning, high-energy 'fuel'--carbohydrates. Those sensible foodstuffs furnish us with all the essential fats we need, the ones that our bodies cannot synthesize from carbohydrates. They give us ample, but usually not excessive, quantities of proteins. They provide large quantities of fibers that help prevent or cure our intestinal problems. They supply us with all our vitamins except vitamin D, which we ourselves synthesize, and vitamin B12, which we can obtain from natural bacteria in our bodies or by supplementing with pills. They offer abundant sources of the minerals we require. Just as important as what they provide is what they withhold: Starches, vegetables, and fruits contain the smallest possible quantities of undesirable non-nutrients." [John McDougall, MD, p. 51]

"Vegetables, fruits and whole grains should take up the largest portion of your dinner plate. Eat these foods first, rather than reserving them for the end after you've finished other items. . . . Eat only food that's in its natural state or is lightly processed--'real food.' . . . Legumes, namely beans, lentils, and peas, are excellent source of protein because they have no cholesterol and very little fat." [The Mayo Clinic Diet, p. 24, 52, 129]

"When we evaluate the standard American diet, we find the calories coming from phytochemical-rich foods, such as fresh fruits, vegetables, beans, intact whole grains, raw nuts, and seeds, are less than 13 percent of the total caloric intake. This dangerously low intake of unrefined plant foods guarantees weakened immunity to disease, frequent illness, and a shorter lifespan." [Joel Fuhrman, MD, p. 2-3]

Is Particle Size Important in Pulmonary Toxicology?

Particle size is very important in pulmonary toxicology. In air pollution terminology, PM10 refers to particles less than 10 microns in diameter such as dust, pollen, and mold. PM2.5 refers to combustion particles, organic compounds, and metals with diameters <2.5 microns. PM10 passes the larynx (thoracic fraction); PM2.5 reaches the alveoli (respirable fraction). Protein molecules are in the range of 1-100 nanometers (<0.1 micron), and there are many allergenic proteins that cause occupational asthma (aerosols of enzymes, laboratory animals, insects, fish, latex rubber, etc.)
The increased latex allergy (contact urticaria, asthma, and anaphylaxis) since the beginning of the AIDS epidemic is explained by increased exposure of healthcare workers to latex proteins from protective gloves.

What Happens to Food Particle Size when Food is Processed by High-Speed Machines?

When a student at Indiana University, I had a job in the chemistry department helping a research team study a particular enzyme. Enzymes are proteins, and this protein could be isolated by first liquefying pig hearts in a blender and then adding this mixture to a separating column. We got the pig hearts from a local slaughtering house. Hemoglobin is a protein molecules with a size of about 6 nanometers. A nanometer is one billionth of a meter or one thousandth of a micron. A red blood cell can be seen in a microscope and has a diameter of about 10 micron. So a protein molecule is about 1000 times smaller than a red blood cell. High-speed food processing converts food from cells (microns) into molecules (nanoparticles). Food that has been converted into nanoparticles is not handled by the body in the same way as whole food. 

Could the Obesity Epidemic Be Related to the Particle Size of Food?

My theory is that eating processed food makes you fat because of the particle size. If you eat whole food, some of the cells are broken down enough by chewing, acid in the stomach, and digestive enzymes in the stomach and intestines to produce molecules that can be absorbed through the intestinal villi. What is not digested continues through the GI tract as roughage. If you eat processed food in which all of the cells have been converted into molecules, then almost everything is absorbed (more calories) and you get fat. You also may get small stools, constipation, and hemorrhoids!

Could the Increased Prevalence of Allergies Be Related to the Particle Size of Food?

The processing of food with high-speed machines began with the industrial revolution. My grandparents did not eat a lot of processed food. My generation was the one to grow up on TV and Cocoa Puffs. Could the increased incidence of gluten and peanut allergies be secondary to increased number of people being exposed to higher concentrations of the naked proteins in their guts secondary to high-speed processing of peanuts and wheat to break up the cells and release the proteins?

Friday, May 24, 2013

How Many Chemicals Are There in the World?

According to the Chemical Abstracts Service (CAS), 60 million substances were registered as of May 24, 2011. Counting chemicals is like counting bacteria--it is difficult to get to an end point. Surely, however many chemicals counted, many more can by made by various reactions (e.g., synthesis, decomposition, displacement, or combustion) of already existing chemicals.

According to the Wikipedia article on bacteria, "Following present classification, there are a little less than 9,300 known species of prokaryotes, which includes bacteria and archaea but attempts to estimate the true number of bacterial diversity have ranged from 107 to 109 total species – and even these diverse estimates may be off by many orders of magnitude." From "9300 known" the number drops to several hundred significant bacterial infections as described in Control of Communicable Diseases Manual updated every few years by the World Health Organization.

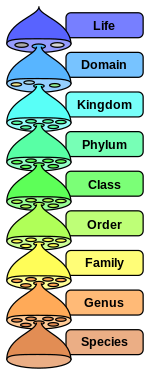
Chemicals are classified in Haz-Map by "Major Category" and "Category." The twelve major categories are Metals, Solvents, Pesticides, Mineral Dusts, Toxic Gases & Vapors, Plastics & Rubber, Biological Agents, Nitrogen Compounds, Other Classes, Other Uses, Dyes, and Physical/Radiation. The medical informatics problem is similar in both toxicology and bacteriology--the need for a hierarchical classification system that converts data into useful knowledge. Instead of an overwhelming list of 60 million chemicals (many of which are mixtures, alloys, drugs, or rarely used research chemicals) there are 250 classes of chemicals within these 12 major categories to assess in Haz-Map.

It is not necessary to test all 80 million substances for us to have a good understanding of occupational toxicology any more than it is necessary for us to study all billion species of bacteria before we can establish an effective program to prevent infectious diseases. For example, there are now in Haz-Map 336 saturated aliphatic hydrocarbons (single-bonded carbon and hydrogen compounds) with similar adverse effects and 63 lead compounds with similar adverse effects. Do we need to test each aliphatic hydrocarbon and each lead compound? The classification of chemicals (or bacteria) is a way to deal with the complexity of nature so that we can control and prevent diseases and not get lost in the details.

Classification for Prevention:
  1. 250 Categories of Chemicals;
  2. 25 Adverse Effects Caused by Chemicals;
  3. Descriptions of Classes of Chemicals;

Wednesday, April 24, 2013

Nanoparticles: Engineering at the Molecular Level

A nanometer (nm) is one billionth of a meter or one thousandth of a micron. The scale in the picture ranges from 0.1 nm (atoms), to 1-100 nm (molecules), to 1000 nm (bacteria and cells). 1000 nm equals 1 micron (1 um). A glucose molecule has a diameter of 1 nm, and a hemoglobin molecule has a diameter of 6 nm. Breathing, eating, and other physiological functions depend upon the interactions of biomolecules, that is, nanoparticles. All cellular biochemistry takes place on the nanometer scale.

The human body has been dealing with nanoparticles (NP) since the beginning. Many ultrafine particles such as fine sand, smoke, diesel fumes, furnace emissions, and welding fumes have diameters in nanometers; these are natural or man-made nanoparticles.

So, why the concern about the safety of engineered nanoparticles? These particles are synthesized intentionally, and generally have a size of between 1 and 100 nm. Compared to larger particles, NP have increased surface area and unique properties such as conductivity, strength, and chemical reactivity. Dust explosions are a potential hazard. According to the IRSST in Quebec, Canada, the engineered nanoparticles of most concern are the long, thin carbon nanotubes and NP that do not dissolve in solution. ". . . the majority of the means of exposure control for ultrafine particles should be effective against NP and much research is currently being carried out to confirm this." There is less concern with older technologies such as microelectronics where "risks are adequately controlled." Now is the time for prevention, "since prevention and monitoring can be carried out at the design and implementation stages of a number of processes."


Saturday, April 6, 2013

Sketch the Map and Then Continuously Improve It

The science of improvement is to ask the fundamental questions shown in the diagram and then to iterate through the Plan-Do-Study-Act cycle. [Institute for Healthcare Improvement] Iteration is defined by Merriam-Webster as "a procedure in which repetition of a sequence of operations yields results successively closer to a desired result." This is not a randomized clinical trial, but it is the scientific method. As Donald Berwick put it, "Did you learn Spanish by conducting experiments? Did you master your bicycle or your skis using randomized trials? . . . Broadly framed, much of human learning relies wisely on effective approaches to problem solving, learning, growth, and development that are different from the types of formal science so well explicated and defended by the scions of evidence-based medicine." [Broadening the view of evidence-based medicine]

The process of improving Haz-Map has gone on for over 20 years. First it was a hobby, and in 2007, it became a full-time job. I took a two-year sabbatical in 1994-96 to work on Haz-Map while completing a fellowship in Occupational Medicine at the University of Washington. When I first started adding data to Microsoft Access from the NIOSH Pocket Guide in 1993, I found a book that helped me to answer the first question in the diagram:

"Intelligent databases are databases that manage information in a natural way, making information easy to store, access and use."
"Early maps only showed a few well-known features like the "Pillars of Hercules" (the modern Straits of Gibraltar) or the island of Sicily. Once the map was outlined in terms of its major features, succeeding generations of mapmakers filled in the details, and the coast-lines, mountains and river systems slowly became more precisely defined. Similarly, the concentric designer begins by sketching out the main features, based on the key constraints, and then successively elaborates these until the details are crystallized." [Parsaye & Chignell. Intelligent Database Tools and Applications. 1993]

Friday, March 22, 2013

Structure-Activity Relationships and the Classification of Chemicals

Haz-Map has been published on the National Library of Medicine (NLM) website since 2002. In 2003, there were 1237 chemicals in Haz-Map, including all regulated by OSHA and published in Documentation of the TLVs and BEIs, 7th Ed. by ACGIH (American Conference of Governmental Industrial Hygienists). Since 2006, the author has been contracted by the US Department of Labor to work full-time to add chemicals to Haz-Map. The count was 5723 in 2010 and is currently 7438. At current rates for completing profiles, the count by the end of this year will be 11,480.

Haz-Map can be seen as a research project to explore what we know and don't know about the thousands of chemicals to which workers are exposed, with application to environmental toxicology as well. In adding chemicals to Haz-Map, the structures of new chemicals are compared to the structures of well-known chemicals already in the database. Most of the new chemicals added can be classified as members of a class. There are now 250 classes (Categories) of chemicals in Haz-Map under 12 Major Categories. It is basic logic that members of a class inherit the properties of that class.

In summary, Haz-Map is a research project to publish the established occupational health effects of hazardous chemicals and to study the structure-activity relationships of workplace chemicals. Such research can help to classify chemicals for the prevention of occupational and environmental diseases.

Sunday, March 17, 2013

With Sufficient Force, Something Happens

In toxicology and pharmacology, the most important factor is the dose. The impact of a poison or drug depends upon its mass and how quickly it is absorbed and excreted. Without sufficient dose, there is no adverse effect (toxicology) or no therapeutic effect (pharmacology).

Paracelsus (1493-1541) was the first physician to understand this concept based on his experiments, "All substances are poisons; there is none that is not a poison. The right dose differentiates a poison, and a remedy." In his experiments, he plotted what we call today "dose-response relationships." Such experiments determine the percentage of organisms or systems that respond to chemicals at increasingly higher doses. Below a certain threshold dose, no adverse effects or therapeutic effects are observed.

The existence of a dose-response relationship strengthens the evidence for a causal relationship between the chemical and the disease. This is fairly simple to do for acute effects like carbon monoxide poisoning. With increasing doses above the threshold dose, increasing number of experimental animals have adverse effects. The dose-response relationship is also important in determining causality in chronic diseases, for example, the fact that moderate smokers have intermediate risks for lung cancer compared with nonsmokers and heavy smokers.